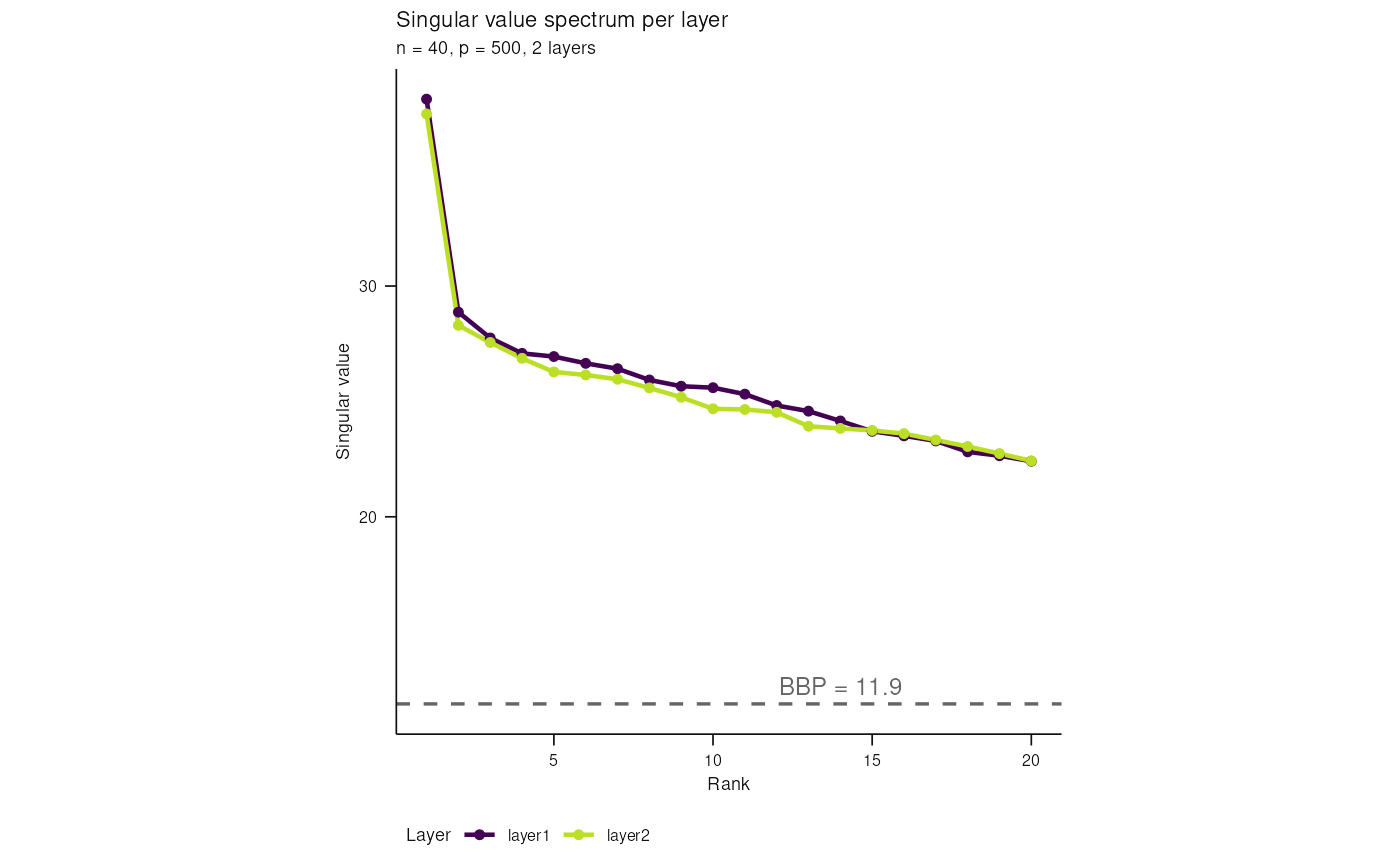
Shows the top singular values of each raw, uncentred assay as a line plot, preserving the legacy descriptive estimand separately from any centred or pre-reduced spectrum used internally by the decomposition strategy. A horizontal reference line at the Baik-Ben Arous-Peche (BBP) phase-transition value \((n \cdot p)^{1/4}\) computed from the first layer. This is a model-based visual reference under spiked white-noise assumptions, not empirical proof that a component is recoverable or biologically valid.
Arguments
- std
StateTransitionDatacarrying stored Stage 1 plot evidence. Fresh legacy objects can be upgraded withprepare_plot_evidence.- n_sv
integer number of singular values to show per layer (default 20)
Details
Use the returned scientific caption to report the assumptions and claim boundary alongside the figure.
Examples
std <- synthetic_control(n = 40L, p = 500L, K = 2L, signal = 30, seed = 1L)
std <- prepare_plot_evidence(std, stage = "stage1")
plot_spectrum(std)