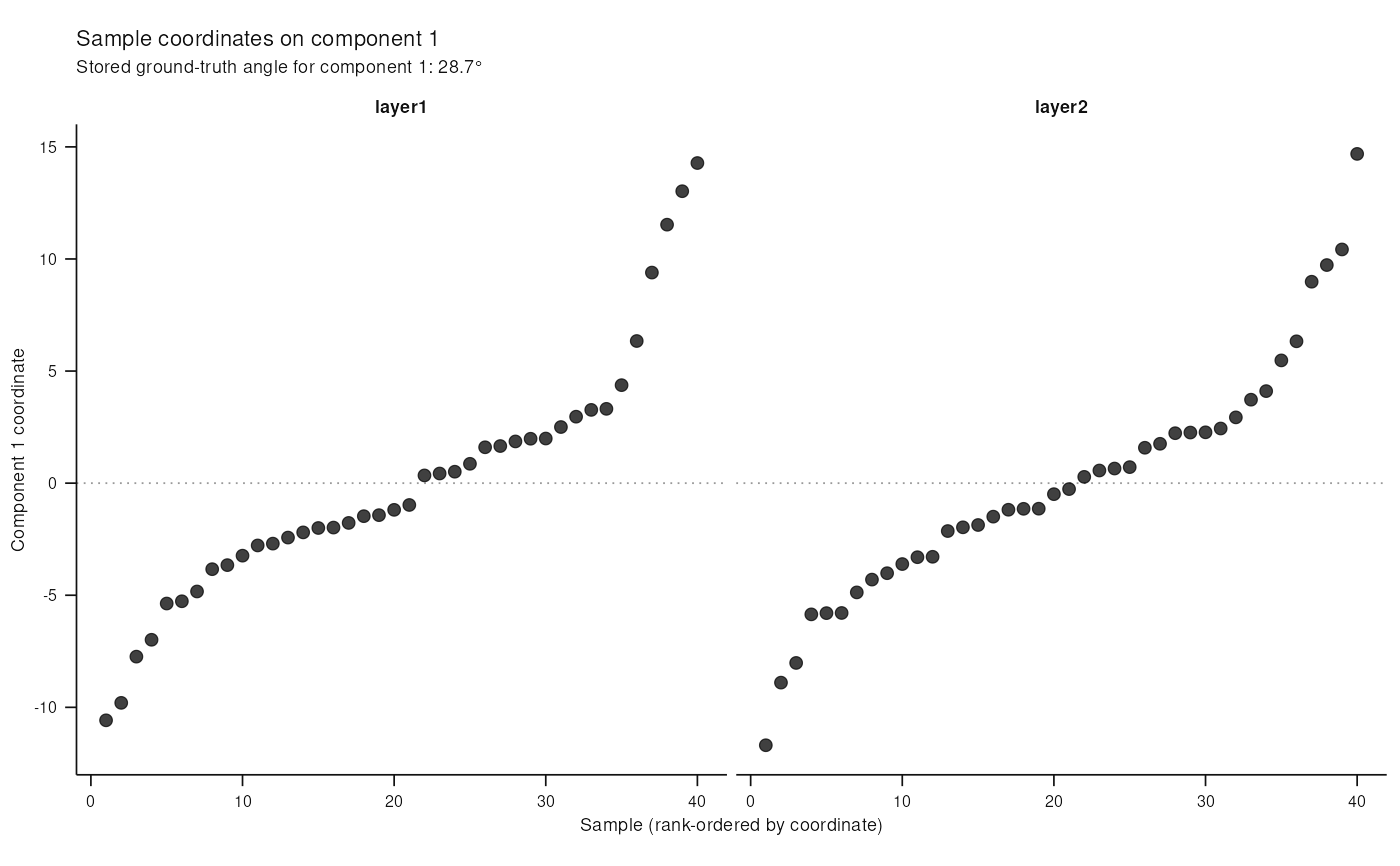
Plot sample coordinates on the recovered state-transition axis (Stage 1 output)
Source:R/14-stage1-plots.R
plot_decomposition.RdShows each layer's sample coordinates along the shared state-transition axis
recovered by Stage 1. When the object carries a SubspaceGroundTruth
(synthetic data), the angle between the recovered axis and the true axis is
annotated.
Arguments
- std
StateTransitionDatawithmetadata()$stage1present- colour_by
character column name in
colData(std)to colour samples by, orNULLfor unlabelled points (defaultNULL)- component
integer – which component column to plot from each layer's coordinate matrix (default
1L). Useplot_components()to inspect descriptive distributions; scientific selection requires the atlas/proposal and confirmation workflow.
Details
This is a descriptive display. It neither selects a component nor confirms biological separation.
Examples
std <- synthetic_control(n = 40L, p = 500L, K = 2L, signal = 30, seed = 1L)
ctor <- get_strategy("Decomposer", "hogsvd_averaged")
std2 <- suppressWarnings(decompose(ctor(), std))@value
plot_decomposition(std2)